Phylogeny
Contents
Phylogeny
Day 1; Responses template for use on computer if desired
Day 2; Responses template for use on computer if desired
Why?
Animal behaviorists use phylogenies to investigate the development of behavior across generations (evolutionary timescales). Critically, a phylogeny is a hypothesis. Phylogenies can be tested and falsified, and can change given new evidence or analytic techniques. Phylogenies can be based on any animal trait. Commonly, in studying animal behavior, you will encounter phylogenies based on genetic sequence data.
Today and tomorrow, you will be working on understanding what phylogenies are and phylogenetic analyses that are used to study animal behavior. All of the information that you need for today is contained on this page. However, this page also links you to tools that you can use in the future to study the phylogenetic basis of behavior.
Genetic Sequences
All animals have genes (generally, sequences of nucleutides, usually abbreviated A, T, G, and C). GenBank is the NIH genetic sequence database, an annotated collection of all publicly available DNA sequences. The nucleotide search lets you search for species names and genes. Here, I have provided you with example sequences from the GenBank to refer to.1
Below are two FASTA files downloaded from GenBank. “FASTA” is a common file format used to store genetic sequence data. The files are very simple; they contain a header followed by a sequence of nucleotide codes. The file header provides metadata about the file (like which gene was sequenced and the sequence length). Click on the file headers to see its contents.
HQ377551.1 Chelonia mydas isolate Satang_4 16S ribosomal RNA gene, partial sequence; mitochondrial; length 510
GGCCGCGGTATCCTAACCGTGCAAAGGTAGCGTAATCACTTGTCTTTTAAATAAAGACTAGAATGAATGG
CCAAACGAGGTTCTACCTGTCTCTTACAAACAATCAGTGAAATTGATCTCCCCGTGCAAAAGCGGGGATA
ACACTATAAGACGAGAAGACCCTGTGGAACTTTAAATACAGATCAACTATCATACCCACTCACTCTAAGG
ACCTATAACTAATTAGTACTTGACCTATATTTTTGGTTGGGGCGACCTCGGAGTAAAACAAAACCTCCGA
AAAAAGAATACACTTCTTAACCTAGACCCACAATTCAAAGTGCCAACGGCAAAATGATCCAATATATTTG
ATCAACGAACCAAGCTACCCCAGGGATAACAGCGCAATCCCATCCTAGAGTTCCTATCGACGATGGGGTT
TACGACCTCGATGTTGGATCAGGACATCCTGATGGTGCAACCGCTATCAAGGGTTCGTTTGTTCAACGAT
TAACAGTCCTACGTGATCTG
FJ039971.1 Eretmochelys imbricata isolate EI_Atlantic 16S ribosomal RNA gene, partial sequence; mitochondrial; length 560
GCCTCTAGCAACAACAAGTATTAGAGGTAATGCCTGCCCAGTGACACTGTTAAACGGCCGCGGTATCCTA ACCGTGCAAAGGTAGCGTAATCACTTGTCTTTTAAATAAAGACTAGAATGAATGGCCAAACGAGGTTCCA CCTGTCTCTTACAAACAATCAGTGAAATTGGTCTCCCCGTGCAAAAGCGAGGATAGCACTATAAGACGAG AAGACCCTGTGGAACTTTAAATATAAATCAACTATTTAACTTACCACTCTAAAGACTTATAATTTACTAG TTCTGATCCATATTTTTGGTTGGGGTGACCTCGGAGAAAAACAAAACCTCCGAAAAAAGAACATATCTTC TTAACCTAGACCCACAACTCAAAGTGCCAACGGAAAAATGATCCAATATATTTGATCAACGAACCAAGCT ACCCCAGGGATAACAGCGCAATCCCATCTTAGAGTCCATATCGACGATGGGGTTTACGACCTCGATGTTG GATCAGGACATCCTGATGGTGCAACCGCTATCAAGGGTTCGTTTGTTCAACGATTAACAGTCCCACGTGAT
From Yang et al (2014): “With few exceptions, the cells of all eukaryotic species contain mitochondria. The mitochondrial genome comprises a double-stranded DNA molecule that accounts for 1% to 2% of the total DNA in mammalian cells. Typical animal mitochondrial DNA (mtDNA) has a high mutation rate. The accelerated evolutionary rate of animal mtDNA implies that significant amounts of sequence variation could be observed in closely related species—a useful feature for species identification procedures.”2
From Relatedness to Trees
In a tree representation of a phylogeny (Figure 9), the tips of branches represent extant (versus extinct) species. The tree is rooted with the Last Common Ancestor (LCA) of all extant species on the tree (the evolutionarily oldest species of the tree). Each branch point from the root is a point of evolutionary divergence. We talk about species being closer to each other on a phylogenetic tree as being more related (having a higher relatedness).
⏳ 10 min
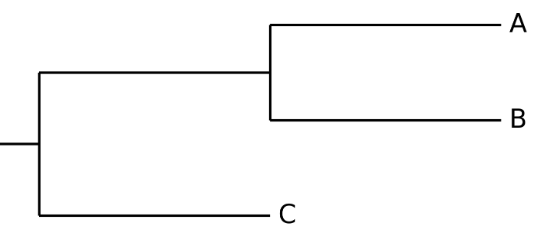
Fig. 9 An example phylogenetic tree.
The following table reports the number of mtDNA sequence differences between extant species in the example phylogeny (Figure 9).
B |
C |
|
|---|---|---|
A |
5 |
23 |
B |
- |
23 |
Q1: How many extant species are there in the tree?
Q2: How many points of divergence are there?
Q3: If there are fewer branch points between two species, do they have more or fewer differences in their mtDNA sequence?
Q4: Given the sequences shown in the two FASTA files that you already examined, why would it be difficult to determine differences in the genetic sequence between species?
⏸️ PAUSE here for class-wide discussion
⏳ 10 min
Sequence Alignment
The online webtool MUSCLE was developed to align genomic sequences across species. The following is the output of the MUSCLE alignment procedure for a genetic sequence (16S ribosomal RNA partial gene sequence) from 7 species of turtles:
Hawksbill        AACTAT-TTAACTTACC-ACTCTAAAGACTTATAATTTACTAGTTC-TGATCCATATTTT
Loggerhead       AACTAT-TATATTTACC-ACCCTAAAGACTTATAATTAACTAGTTC-TGATCCATATTTT
Olive            AACTAT-CACACTTACT-ACCCTAAAGACTTATAACTTACTAGTTC-TGATCCATATTTT
Kemp’s           AACTAT-TACACTTACT-ACCCTAAAGACTTATAACTTACTAGTTC-TGATCCATATTTT
Leatherback      AACTACACATCCACACCTAATCTAAGGACTTATAACCAACTAG-ACTTGATCCATATTTT
Flatback         AACTAT-CATACTCACCCACCCCAAGGACCTATAACTAACTAATACTTGACCTATATTTT
Green            AACTAT-CATACCCACTCACTCTAAGGACCTATAACTAATTAGTACTTGACCTATATTTT
                 *****         **  *  * ** *** *****   * **   * *** * *******
Q5: What does the star mean for a column of letters (molecules in the gene sequence)?
Q6: Define and compute a metric of relatedness (genetic similarity) between Hawksbill and Loggerhead turtles based on sequence (dis)similarity.
Q7: Use the same method to compute the relatedness between Hawksbill and Green turtles.
Q8: If you used the example phylogeny (Figure 9) for these three turtle species (Hawksbill, Loggerhead, and Green), which letter (A, B, or C) would most likely correspond to each turtle species?
⏸️ PAUSE here for class-wide discussion
⏳ 5 min
Q9: Based on all of the information provided so far, how would you define ‘phylogeny’?
Q10: Remember that a phylogeny is a hypothesis. What is an ‘alternative hypothesis’ for the example phylogeny (Figure 9)?
⏸️ PAUSE here for class-wide discussion
Readily available computer algorithms can calculate relatedness from aligned genetic sequence data and generate a drawing of the most likely phylogeny.
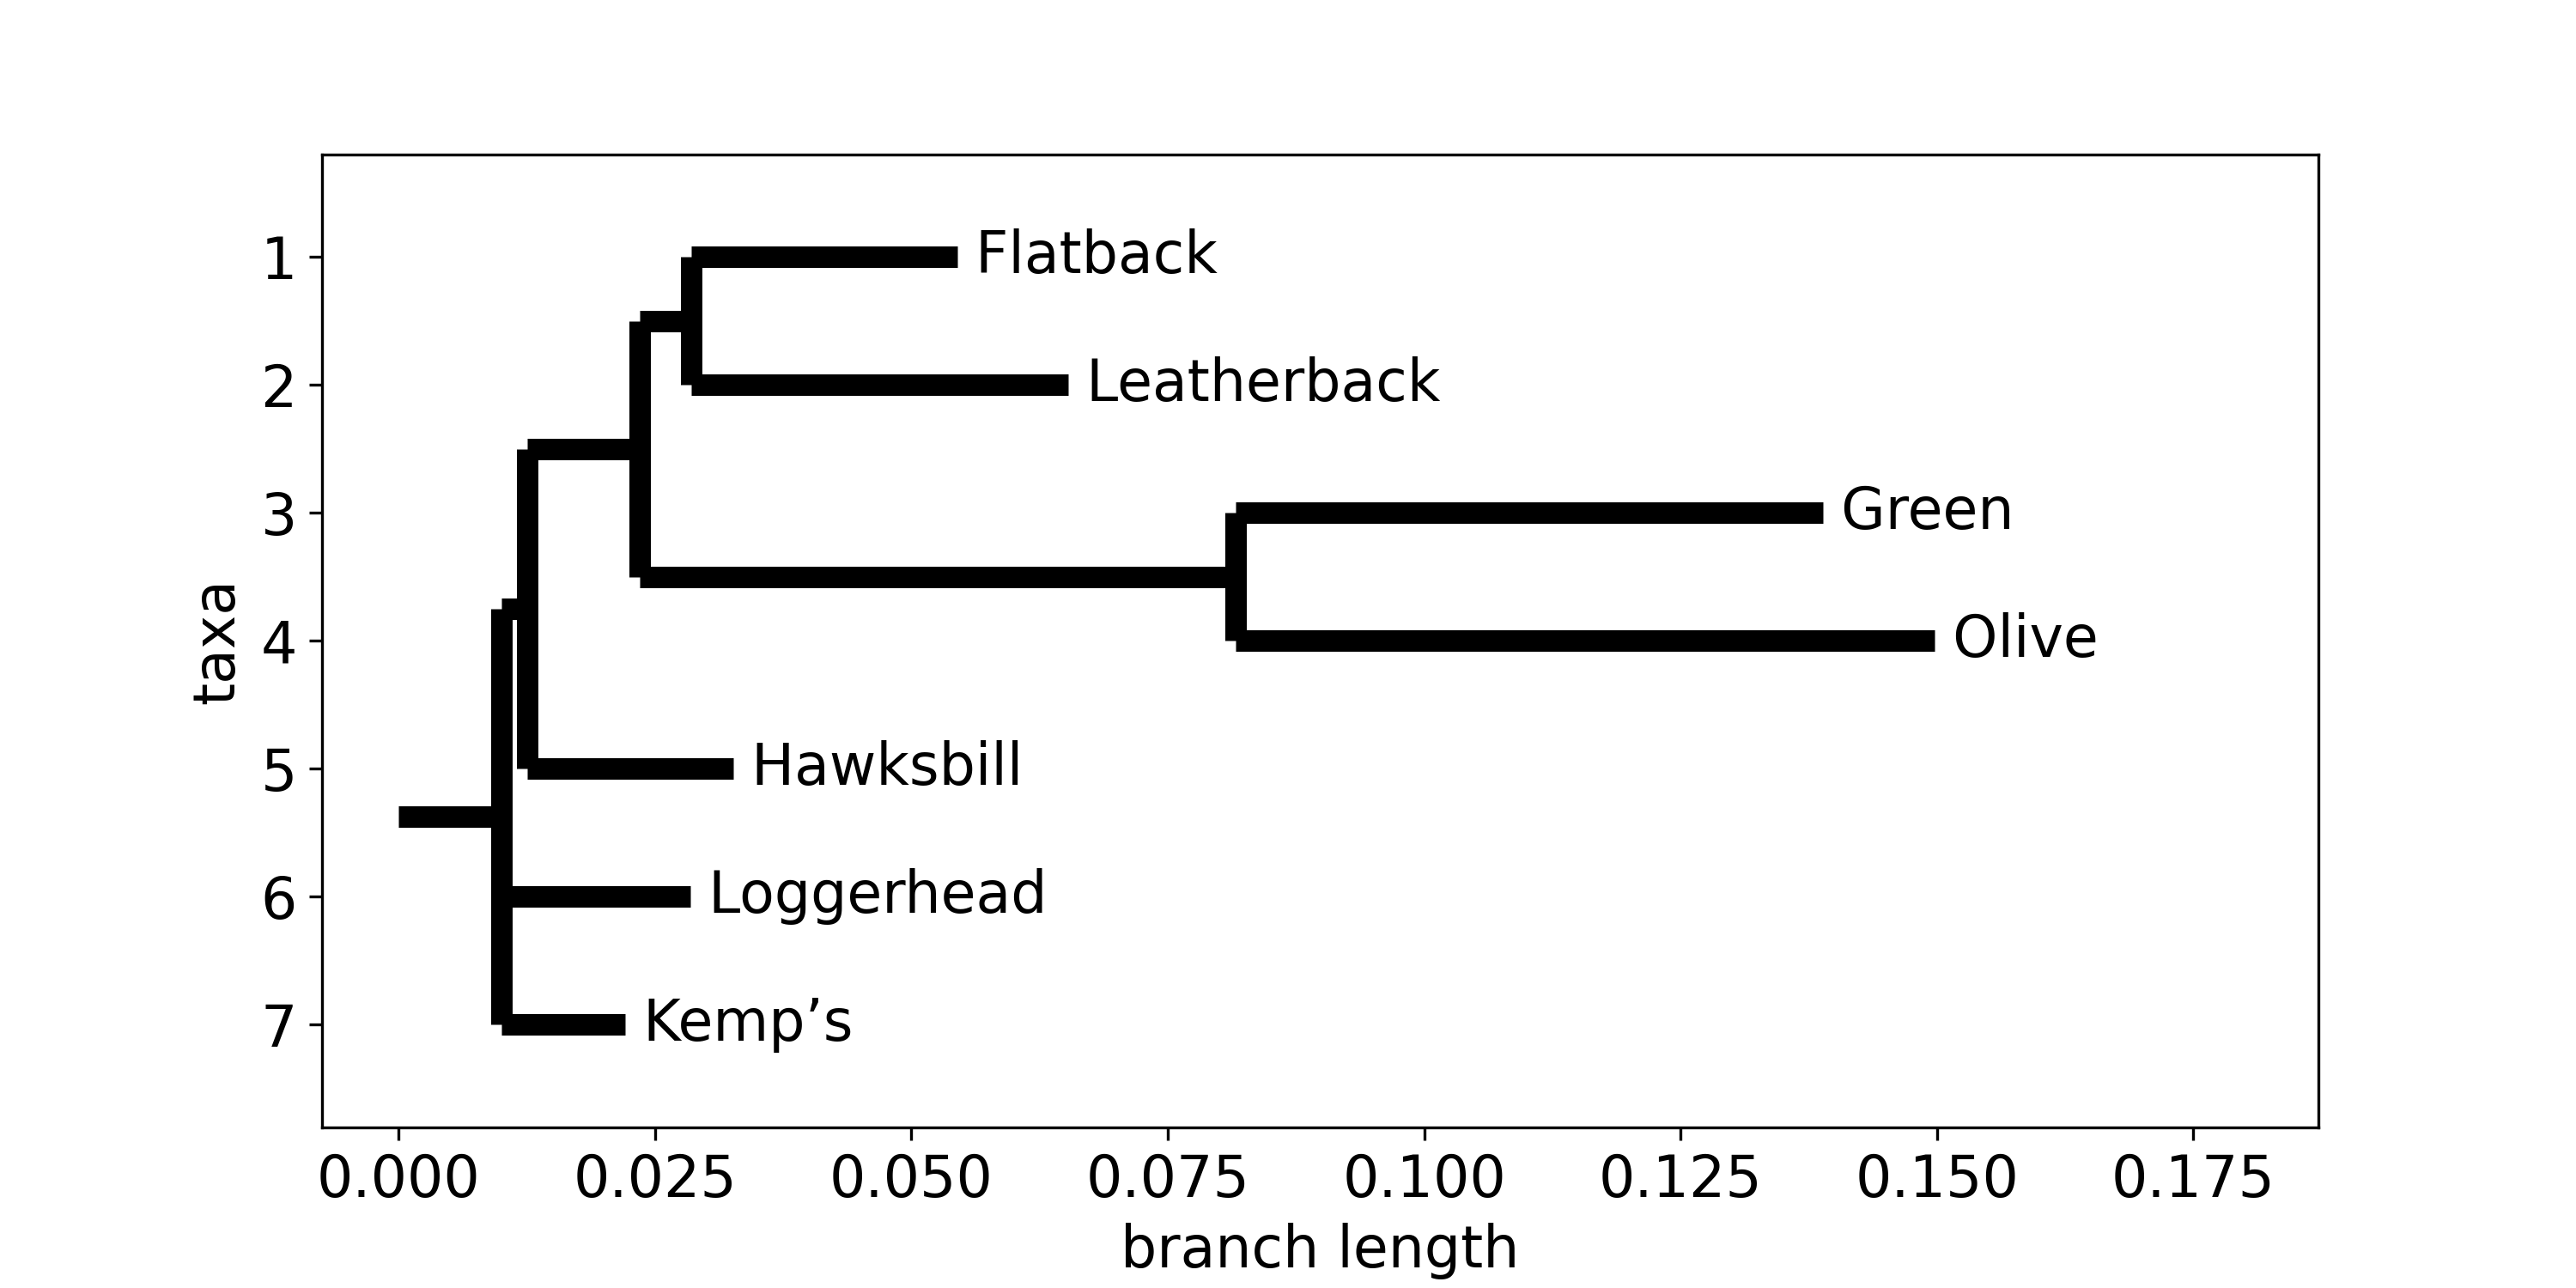
Fig. 10 A phylogenetic tree of 7 turtle species. Relatedness and branch lengths were calculated from the MUSCLE alignement data of the 16S ribosomal RNA partial gene sequence using BioPython.
Many published phylogenetic trees exist that you can explore without needing to obtain or analyze any genetics yourself. For example, here is the entry on OpenTree that includes all 7 turtle species you have just examined. This tree is rooted at Cheloniidae (the sea turtles), which is a monophyletic group.
In this web interface, branches of the tree are sometimes collapsed for visual clarity. Clicking on a branch line in the tree (or the “i” next to a node) reveals how many extant species derive from that branch. Clicking on each node in the tree roots the visualization at that node (often expanding/collapsing sets of branches as the view changes).
Clicking on theiicon next to a node brings up a menu with aSearch EOL for 'node name'link. EOL is the “Encyclopedia of Life”. This non-profit is a great resource for biodiversity information.
Practice navigating around the tree.
Think about an animal whose behavior you are interested in and practice researching its phylogenic history and relationships.
⏹️ STOP here for today
From Trees to Behavioral Evolutionary History
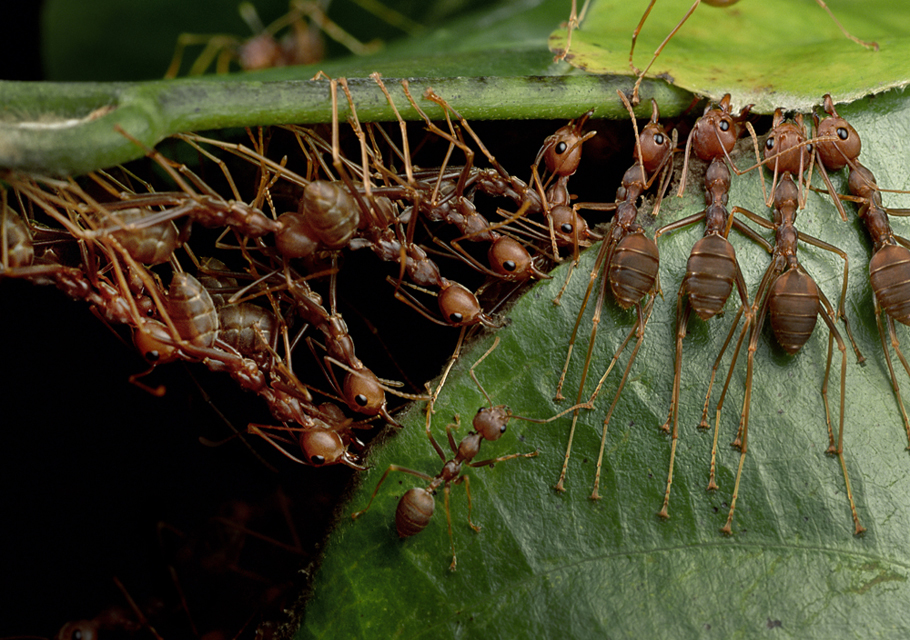
If you search the Animal Diversity Web (for example), you will find that, of the 7 turtle species you have just examined, all but one are classified as solitary. The green turtle (Chelonia mydas) is classified as colonial3.
From a phylogenetic perspective, why is the green turtle colonial? Either colonialism is an inherited behavior or colonialism is a derived behavior.
In order to determine whether colonialism is derived or inherited, we need an ancestral state reconstruction. To create this reconstruction, we need to:
make a character mapping
test all alternative hypotheses for the ancestral state reconstruction.
So what is a character mapping, an ancestral state reconstruction, the hypothesis testing, etc? We will work through the next two sections to learn about the process…
⏳ 10 min
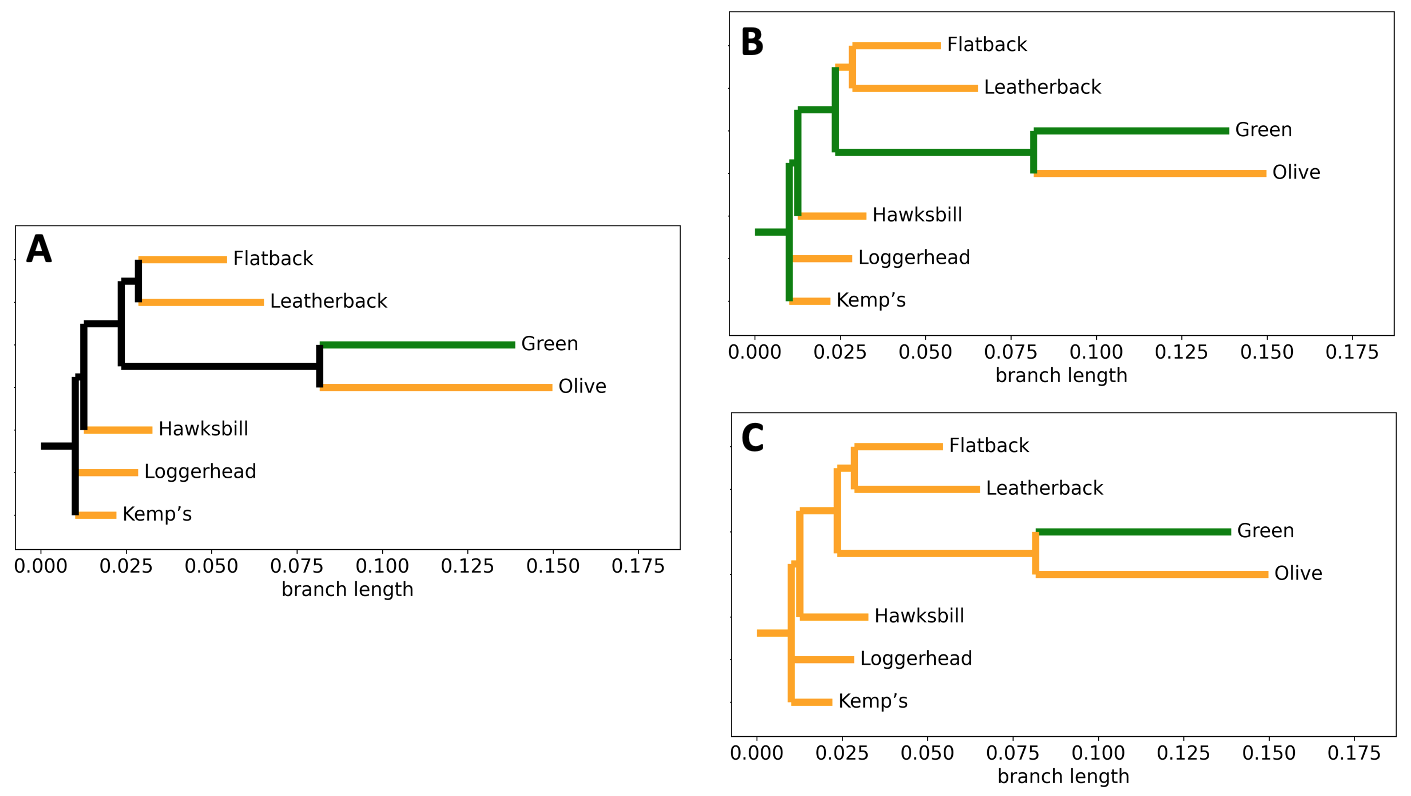
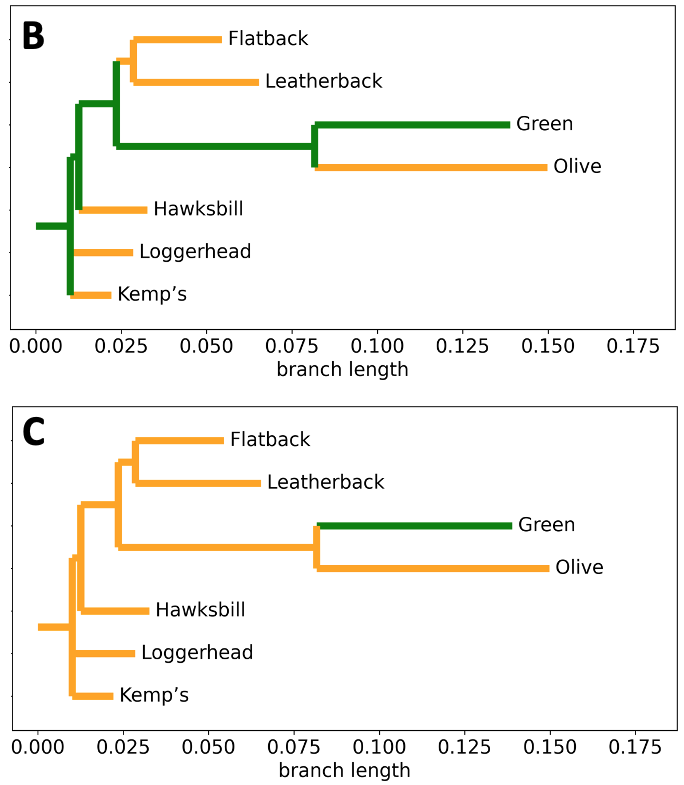
Fig. 11 Graphical representations of character mapping and ancestral state reconstruction. To construct the turtle phylogeny, relatedness and branch lengths were calculated from the MUSCLE alignement data of the 16S ribosomal RNA partial gene sequence using BioPython.
A) Character mapping of social behavior on the turtle phylogeny.
Green = colonial. Orange = solitary.
B) Ancestral state reconstruction under Hypothesis #1 on the turtle phylogeny.
C) Ancestral state reconstruction under Hypothesis #2 on the turtle phylogeny.
Q1: Based on the information given, what do you think ‘character mapping’ is?
Q2: Under Hypothesis #1 for the ancestral state reconstruction, the last common ancestor (LCA) of this turtle phylogeny exhibited ______________ behavior (fill in the blank).
Q3: Under Hypothesis #2 for the ancestral state reconstruction, the LCA of this turtle phylogeny exhibited ______________ behavior (fill in the blank).
Q4: How is character mapping different than ancestral state reconstruction?
Q5: Under which ancestral state reconstruction hypothesis (1 or 2) would colonialism be an inherited (versus derived) trait in green turtles?
⏸️ PAUSE here for class-wide discussion
⏳ 15 min
One common way to assess alternative hypotheses for the LCA behavioral trait is to use an argument of parsimony. Answer the following questions to understand the logic of making an argument about LCA behavior based on parsimony.
Q6: If the LCA of the turtles in Figure 11 was solitary, what is the least number of total evolutionary changes that would need to occur (across the tree) to result in the correct behavioral traits of all 7 extant species?
Q7: If the LCA of the turtles in Figure 11 was colonial, what is the least number of total evolutionary changes that would need to occur to result in the correct behavioral traits of all 7 extant species?
Q8: Which alternative hypothesis would require more evolutionary changes?
By an argument of parsimony, we would conclude that it is less likely that the LCA was colonial. Therefore, the evidence supports Hypothesis #1 less than Hypothesis #2.
Q9: From that conclusion, which would you infer is more likely: evolutionary change or evolutionary stasis?
Q10: Create your definition for the “argument of parsimony”.
Q11: If no one had yet characterized the behavior of Flatback and Leatherback turtles, would it change the results of your analysis? How would you handle this unknown data in your analysis?
⏸️ PAUSE here for class-wide discussion
Importantly, by reconstructing the evolutionary history of behaviors, we can determine whether extant species that share the behavior converged on the same adaptation or whether they inherited from a common ancestor. Similarly, points of divergence can be significant to our understanding of the behavior.
Case Study: Vocal Learning
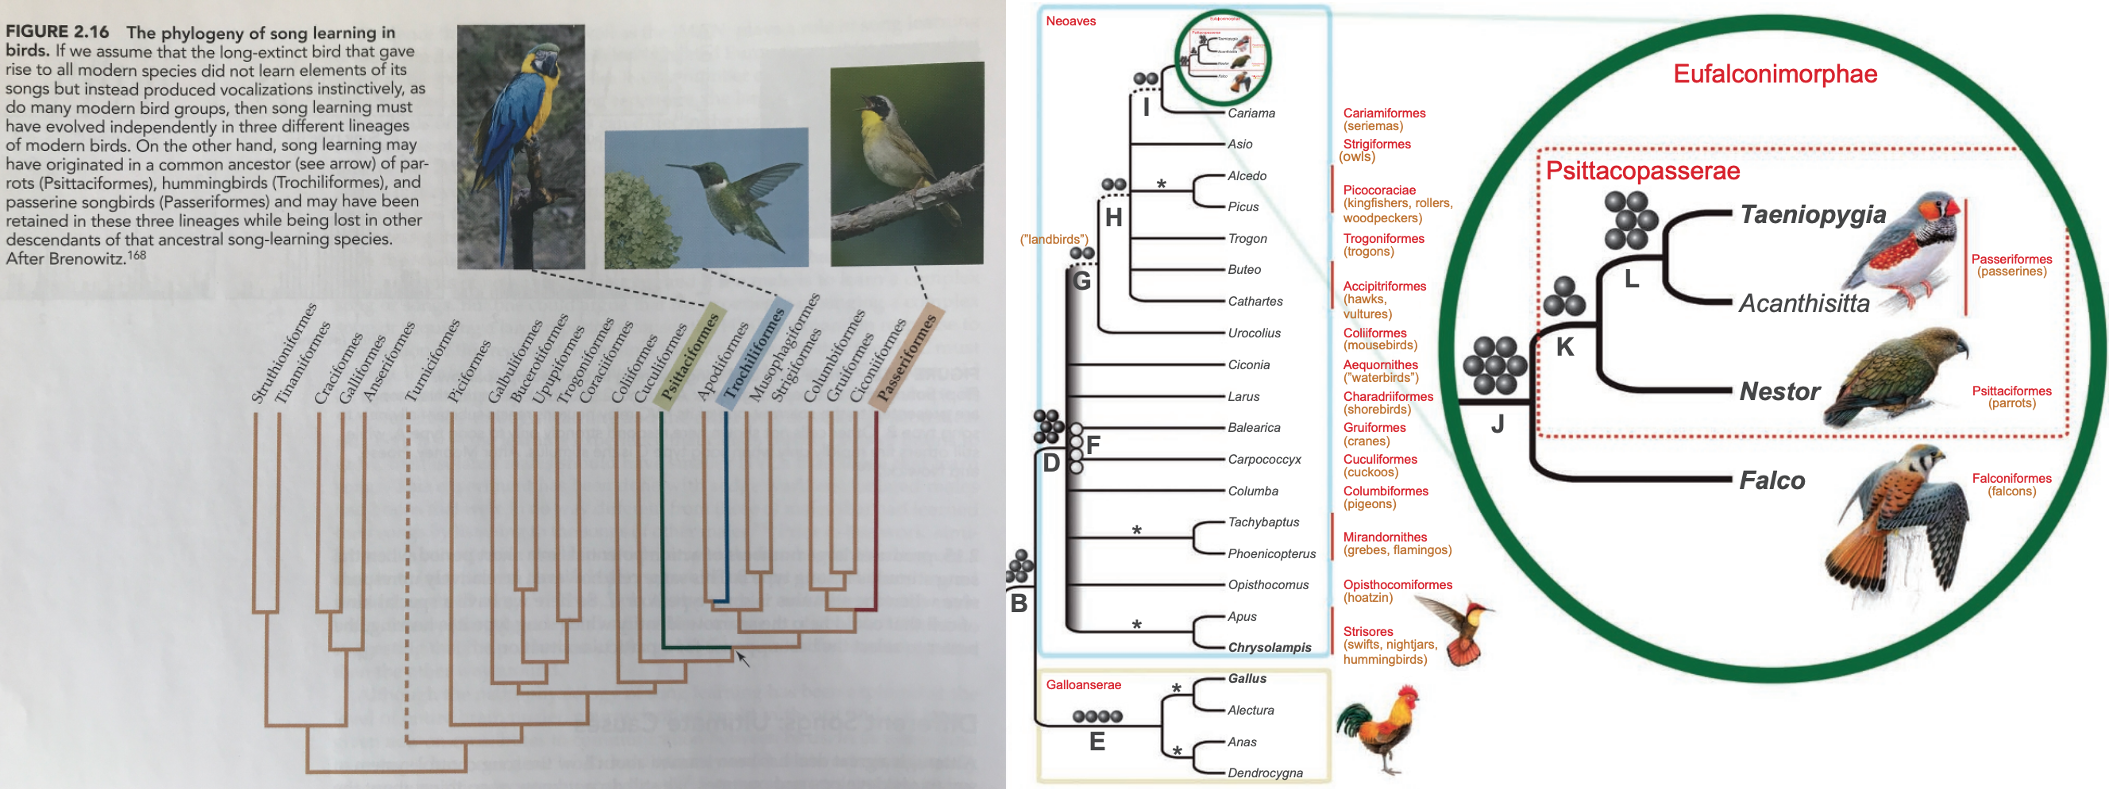
Fig. 12 Phylogeny of Neoaves (By clicking on the image you can zoom in).
A) From the Animal Behavior, 9th edition textbook by Rubenstein and Alcock (2009). Phylogeny data generated using DNA-DNA hybridization4 (basically an analog version of the MUSCLE alignment algorithm and published by Eliot A. Brenowitz in Evolution of the vocal control system in the avian brain5. Character mapping of vocal learning is highlighted in green, blue, and red.
B) From Suh et al (2011)6. Phylogeny data generated using Mesozoic retroposons7 and analysis utilizing maximum parsimony. New taxa Eufalconimorphae (falcons+parrots+passerines) and Psittacopasserae (parrots+passerines) are highlighted.
⏳ 15 min
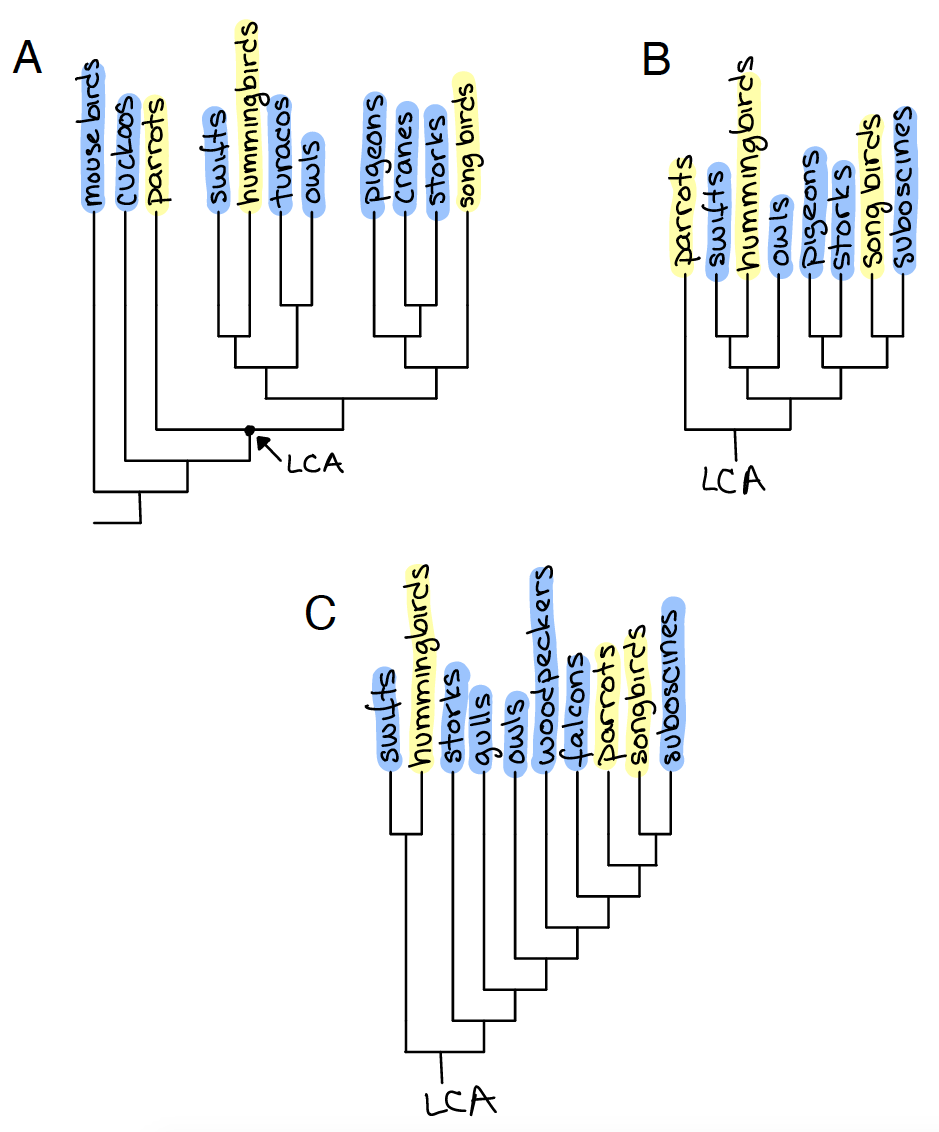
Fig. 13 Character mapping of vocal learning behavior on the phylogeny of Neoaves from Brenowitz (1991)5 in A and B and off of Suh et al (2011)6 in C. Yellow: vocal learners, Blue: vocal non-learners.
Q12: Use the phylogeny in Figure 13A to analyze (using parsimony) the two alternative ancestral state reconstruction hypotheses for the LCA of all song learners (arrow). Make sure to report your quantifications as well as your conclusion.
Q13: Does “simplifying” the phylogeny in Figure 13B change the results compared to Figure 13A?
Q14: Use the phylogeny in Figure 13C to analyze (using parsimony) the two alternate ancestral state reconstruction hypotheses for the LCA of all song learners.
Q15: How does your understanding of vocal learning behavior change based on the two phylogenetic hypotheses (Brenowitz versus Suh)?
⏹️ STOP here for today
Additional Resources
Data for the turtle phylogeny was collected by Lindsay Taylor as part of their example jupyter notebooks implementation of BioPython
- 1
If you want to use this resource directly, you can refer to the FAQ to get you started.
- 2
Yang, L., Tan, Z., Wang, D. et al. Species identification through mitochondrial rRNA genetic analysis. Sci Rep 4, 4089 (2014).
- 3
“Used loosely to describe any group of organisms living together or in close proximity to each other - for example nesting shorebirds that live in large colonies. More specifically refers to a group of organisms in which members act as specialized subunits (a continuous, modular society) - as in clonal organisms.” - ADW”
- 4
(from wiki) The DNA of one organism is labelled, then mixed with the unlabelled DNA to be compared against. The mixture is incubated to allow DNA strands to dissociate and then cooled to form renewed hybrid double-stranded DNA. Hybridized sequences with a high degree of similarity will bind more firmly, and require more energy to separate them: i.e. they separate when heated at a higher temperature than dissimilar sequences, a process known as “DNA melting”. To assess the melting profile of the hybridized DNA, the double-stranded DNA is bound to a column and the mixture is heated in small steps. At each step, the column is washed; sequences that melt become single-stranded and wash off the column. The temperatures at which labelled DNA comes off the column reflects the amount of similarity between sequences (and the self-hybridization sample serves as a control). These results are combined to determine the degree of genetic similarity between organisms. One method was introduced for hybridizing large numbers of DNA samples against large numbers of DNA probes on a single membrane. These samples would have to be separated in their own lanes inside the membranes and then the membrane would have to be rotated to a different angle where it would result in simultaneous hybridization with many different DNA probes.
- 5(1,2)
- 6(1,2)
- 7
(from Suh et al 2011) Retroposons, jumping genetic elements that copy via RNA intermediates and insert nearly randomly anywhere in the genome (although some biases of insertion and retention have been proposed15), provide (by inheritance) virtually homoplasy-free evidence of relatedness that is detectable for more than 100 million years. Because parallel insertions or exact excisions are highly unlikely, presence/absence patterns of retroposons at orthologous genomic loci are powerful, clear-cut phylogenetic markers capable of resolving long-standing uncertainties.
- 8
Figure 1 from Hu and Hoekstra (2017) Peromyscus burrowing: A model system for behavioral evolution. Journal of Cell and Developmental Biology, 61 shows a mapping of both burrowing behavior and habitat on the phylogeny of Peromyscus. You can also start prepping for the next section of the course by thinking about… What correlations do you notice? What do you wonder about the function of burrowing behavior and how that relates to its phylogenetic history?