Observation
Contents
Observation
Responses template for use on computer if desired
Scientists use human perceptions, intuition, and feelings, our inner worlds, to forge novel, testable hypotheses about those of other species.
—Harry Greene1
It is one of our tasks, as people who study animal behavior, to observe and record animal behavior. This is an enourmously complex task.
We often implement several simplifying principles. One of the most common is to categorize behavior into “well-defined” fundamental units. Another is the assumption that only one behavior can happen at each moment in time. Today, you will learn to observe and analyze animal behavior through ethograms and activity budgets with these principles in mind.
Ethogram
Why?
I like to sit on my orange and eat my porch.
Reported observations of animal behavior cannot be used to advance our understanding unless the language is clearly and objectively defined in a way that is recognized by the broader community. One of the way that we communicate this language about behavior is through ethograms.
In preparation for learning how to work with ethograms, you reviewed several specific complexities described by Lorenz: ritualization, superimposition, and learning are all phenomena that make it hard to interpret and understand the behavior of an animal. Keeping these complexities in mind will enrich your experience of ethogram-ing.
⏳ 10 minutes
You have already watched this short video and named/defined 3-5 distinct behaviors that you observed.
Q1: Now, compare your notes among your group and develop a consolidated list of 3 behaviors (actions) you observed that you think were the most common. Include a name and an objective definition for each behavior.
⏸️ PAUSE here for class-wide discussion
Activity Budget
Why?
Time is nature’s way of keeping everything from happening at once
—Ray Cummings2
Another simplifying assumption is that (at each level of behavioral hierarchy), behaviors compete with each other because they cannt happen at the same time. The choices that an animal makes about how it “chooses” to spend its time have dramatic influence on the outcomes of its life. Analyzing how an animal spends its time (behaviorally) is an important aspect of studying animal behavior. Do some behaviors happen more than others? Why might some behaviors happen more than others? The activity budget of an animal/species is the distribution of time allocated across its behaviors.
As an illustration of the activity budget concept, consider the following poem.
One fish two fish red fish blue fish
—Dr Suess
The “word budget” for the poem is the right column:
word |
number of instances |
percent of the poem |
|---|---|---|
one |
1 |
12.5 |
fish |
4 |
50 |
two |
1 |
12.5 |
red |
1 |
12.5 |
blue |
1 |
12.5 |
⏳ 7 minutes
Q2: How many possible words were there in the poem?
Q3: Come up with a general equation that you could use to calculate the budget for any type of similar data (occurrences of possibilities).
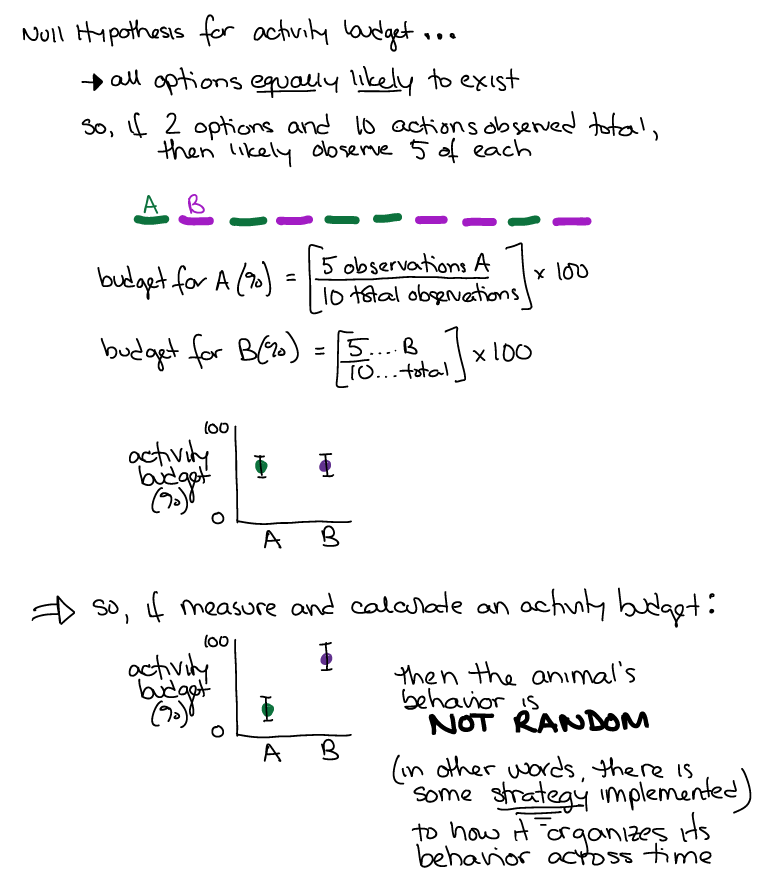
Q4: What is the “null hypothesis” for this word budget (ie. what is the budget that you would expect if the poem was constructed by randomly using the possible words rather than to convey meaning)?
⏸️ PAUSE here for class-wide discussion
Animal behaviorists use ethograms to determine an animal’s activity budget. Activity budgets for behavior are generally presented as either the proportion or percent of time that an animal spends doing each behavior (a form of data normalization).
With your ethograms of meerkat behavior, let’s estimate a meerkat’s activity budget.
We will watch a new video of meerkat behavior. You will each focus on recording the behavior of a single individual. Record the start time of each behavior and the behavior name. It is helpful to have a short code that you can use for each behavior category (e.g. drinking could be denoted with a ‘D’). You can take the data using any format you choose (pen and paper or electronic).
Include other and out of sight as two of your behaviors.
You will use the following format to record your data:
Behavior |
Start time |
Duration |
|---|---|---|
name of behavior |
cummulative seconds |
calculated |
⏳ 5 minutes
Think about which of these columns is “measured data” (ie. needs to be filled out while watching the behavior) and which of these columns is “processed data” (ie. can be filled out after data collection has concluded).
Q5: How would you calculate the processed data from the measured data?
⏸️ PAUSE here for class-wide discussion
We will watch this video. Each person in the group should collect their own data while we watch together. Focus on only one individual’s behavior to collect your data.
We can also check in on these webcams:
⏳ 15 minutes
Q6: Are you going to include or exclude the time spent ‘out of sight’ and/or ‘other’ in the activity budget calculation? Justify your choice.
Q7: Calculate the activity budget from your own data and then collect everybody’s results on the same plot (using paper and pen/pencil/whatever). Indicate data from different group members using different symbols for the data points. Hand in your graph at end of class.
⏹️ STOP here for today
Making Connections (optional)
Q: How is the issue of ‘superimposition’ of behavior different from or similar to the issue of ‘hierarchy’ of behavior?
Q: How could behavioral learning make it difficult to categorize/define an animal’s behavior?