
Week 9. ElectroRetinoGram
Contents
Week 9. ElectroRetinoGram
Phototransduction, the process by which light energy is absorbed and converted into an electrochemical signal, is an ancient trait common to nearly all present day animal phyla
Photoreceptor cells
Receptor cells typically respond to stimuli with prolonged, graded potentials. Some receptor cells also have spike-generating mechanisms. Photoreceptor cells are a type of receptor that do not produce spikes.
Rhodopsin is a visual pigment found in photoreceptor cells that is responsible for initiating visual phototransduction. Rhodopsins in all animals are made up of an opsin protein, a member of the 7 transmembrane G protein-coupled receptor family, and an associated chromophore which is derived from retinal or a similar molecule. Opsin amino acid sequence and chromophore structure affect the absorbance of rhodopsin to different wavelengths of light (different rhodopsins are more likely to absorb photons at different wavelengths).
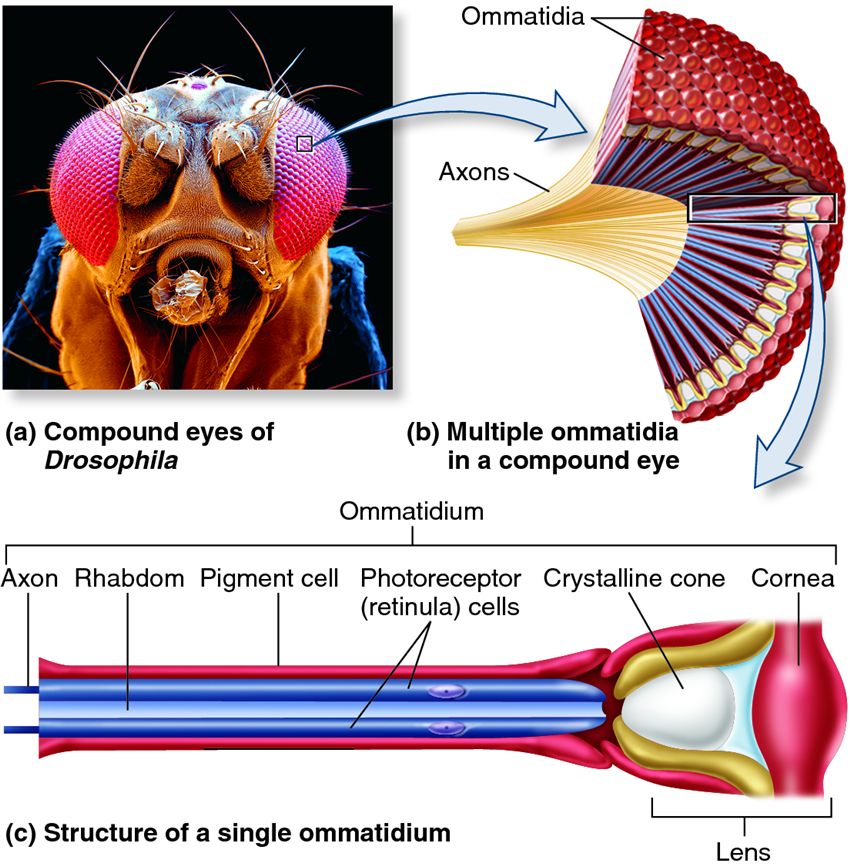
Photoreceptors transform light energy into electrical energy via second messengers. When a photon is absorbed by the chromophore the rhodopsin becomes activated, initiating a G-protein cascade in the cell that ultimately leads to the opening of membrane-bound ion channels. Photoreceptor transduction has mostly been studied in Drosophila (another species in the Phylum Arthropoda)1. Transient receptor protein (TRP) channels are the ultimate target of the molecular cascade initiated by rhodopsin-detected photons. There is a lag between the time in which the second messenger system is activated by rhodopsin and the opening of TRP channels. You will be able to measure the time it takes for this metabotropic transformation!
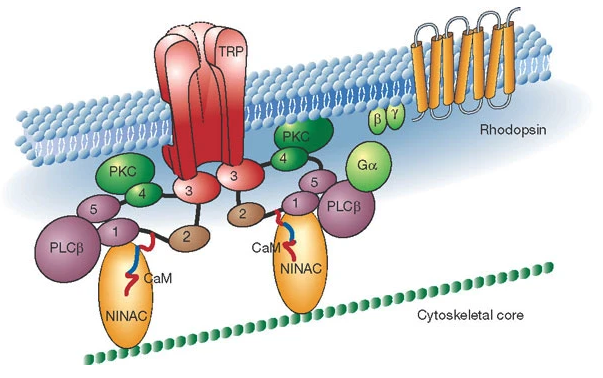
Fig. 26 Cartoon of the proteins involved in the transduction of light energy into electrical energy. The Gq α-subunit acts as a diffusible shuttle between activated rhodopsin and the complex.1
Changing the brightness of the light will change the number of rhodopsin molecules that are activated, and thus the amount of second messenger that is produced. This is analogous to varying the amount of transmitter at a metabotropic synapse. Therefore, the graded potential changes that photoreceptor cells undergo can be measured as a relative change in response amplitude with changing light stimulus.
Any photon that is absorbed by rhodopsin will induce the same kind of response. In practice, this means that a cell’s raw response amplitude will increase due to either an increase in light intensity (more photons to absorb), or to a shift in wavelength toward its peak sensitivity (higher probability of rhodopsin absorbing that wavelength).
Vertebrate versus Invertebrate
The following video provides a brief overview of differences in phototransduction between drosophila and humans: (You should be able to view this video signed in with your Wesleyan gmail, but please do not share this video with others, it was shared with me personally from Ilya, not publicly. Let me know if you cannot see the video and I will share it another way).
Two main differences between vertebrate and invertebrate physiology is the sign of signal transmission. Invertebrate photoreceptors depolarize in response to light, and (at least in the fly) release an inhibitory neurotransmitter (histamine). Histamine opens chloride-permeable ionotropic Histamine receptors. Vertebrate photoreceptors hyperpolarize in response to light, and release an excitatory neurotransmitter (glutamate).
The photoreceptor cells of invertebrate animals differ from those of vertebrates in morphology and physiology in many ways. These differences include: (From B Rayer 1, M Naynert, H Stieve 1990 Phototransduction: different mechanisms in vertebrates and invertebrates.):
In invertebrates, rhodopsin is converted by light into a meta-rhodopsin which is thermally stable and is usually re-isomerized by light. In contrast, photoisomerization in vertebrates leads to dissociation of the chromophore from opsin, and a metabolic process is necessary to regenerate rhodopsin.
The electrical signals of visual excitation have opposite character in vertebrates and invertebrates: the vertebrate photoreceptor cell is hyperpolarized because of a decrease in conductance and invertebrate photoreceptors are depolarized owing to an increase in conductance.
Single-photon-evoked excitatory events, which are believed to be a result of concerted action (the opening in invertebrates and the closing in vertebrates) of many light-modulated cation channels, are very different in terms of size and time course of photoreceptors for invertebrates and vertebrates. In invertebrates, the single-photon events (bumps) produced under identical conditions vary greatly in delay (latency), time course and size. The multiphoton response to brighter stimuli is several times as long as a response evoked by a single photon. The single-photon response of vertebrates has a standard size, a standard latency and a standard time course, all three parameters showing relatively small variations. Responses to flashes containing several photons have a shape and time scale that are similar to the single-photon-evoked events, varying only by an amplitude scaling factor, but not in latency and time course.
In both vertebrate and invertebrate photoreceptors the single-photon-evoked events become smaller (in size) and faster owing to light adaptation. Calcium is mainly involved in these adaptation phenomena. All light adaptation in vertebrates is primarily, or perhaps exclusively, attributable to calcium feedback. In invertebrates, cyclic AMP (cAMP) is apparently another controller of sensitivity in dark adaptation.
The interaction of photoexcited rhodopsin with a G-protein is similar in both vertebrate and invertebrate photoreceptors. However, these G-proteins activate different photoreceptor enzymes (phosphodiesterases): phospholipase C in invertebrates and cGMP phosphodiesterase in vertebrates.
For more, see Sanes and Zipursky (2010) Design Principles of Insect and Vertebrate Visual Systems. Neuron
Local Field Potential (LFP)
A popular measure of neural population activity in the brain is the local field potential (LFP), which represents summed synaptic activity located in small volume around the recording site. Although LFP is easy to record, it has proven notoriously difficult to interpret and model. These difficulties partially originate from the complexity of neuronal coding, but they also result from the very nature of the LFP signal, which represents the neuronal activity only indirectly through the flow of the extracellular currents. This current flow depends on a number of parameters such as the neuronal morphology, synaptic receptors, membrane ion channels, electric properties of the tissue, brain area and cortical layer impeding the interpretation of the resulting LFP signal.
The LFP of the retina (the Electroretinogram) is not as difficult to interpret as LFPs elsewhere in the brain.
Electroretinogram (ERG)
The electroretinogram (ERG) is a LFP measurement of the summed (net) membrane potential from the retina, which primarily reflects the activity of a population of photoreceptors, but can also include post-synaptic activity of the lamina cell population (in invertebrates) or bipolar cell population (in vertebrates).
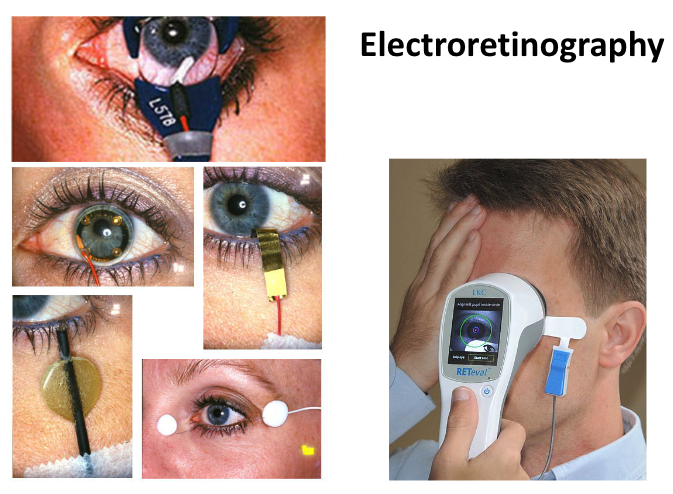
Fig. 27 Electroretinography is used as a clinically diagnostic tool in humans.
If you don’t know whether a features of the ERG waveform is caused by photoreceptors or postsynaptic neruons, you can use pharmacology to dissect the signal. Any procedure that blocks synaptic transmission from the photoreceptors, will eliminate features of the ERG waveform that are not caused by photoreceptor polarization.
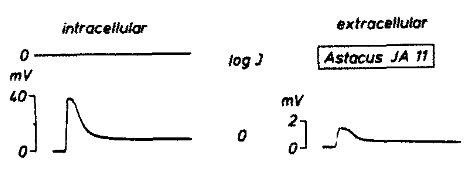
In crayfish, previous work has shown that the waveform of the ERG is a good representation of intracellular events in the photoreceptors, as demonstrated by simultaneous intra- and extra-cellular measurement of photoreceptor potentials2. As in other extracellular recordings, depolarization of the cells appears as a negative potential to the electrode outside the cells.
Crayfish neuroanatomy
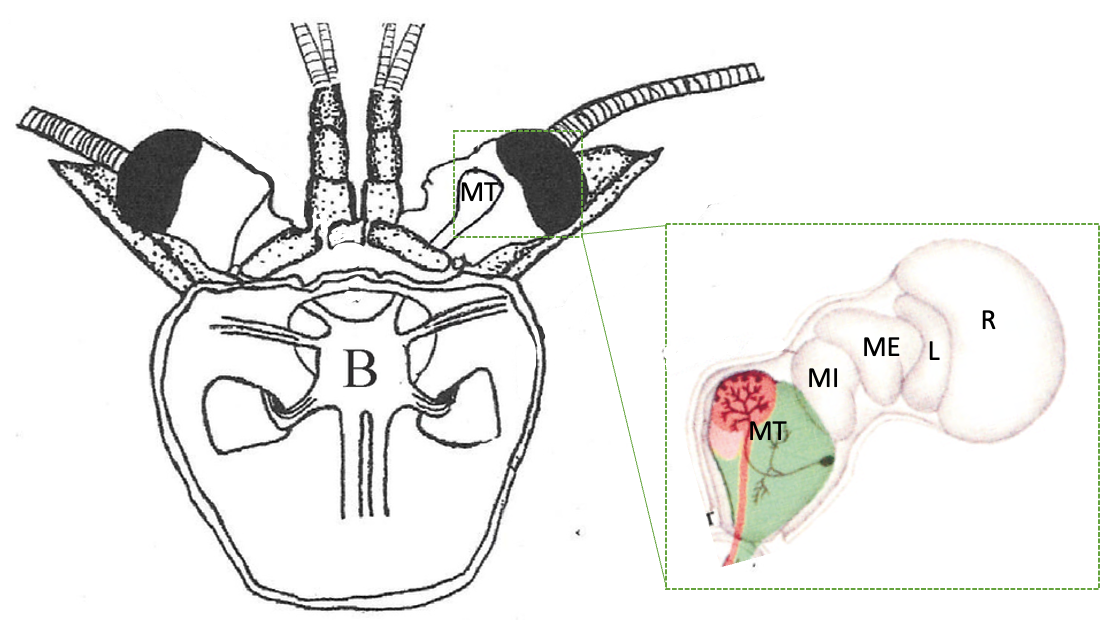
Fig. 29 Dorsal view diagram of the brain within the head carapace and the neural structures within the optic cups. MT: terminal medulla (lateral protocerebrum: LP), MI: internal medulla, ME: external medulla, L: lamina, R: retina. (From DeForest Mellon Jr3)
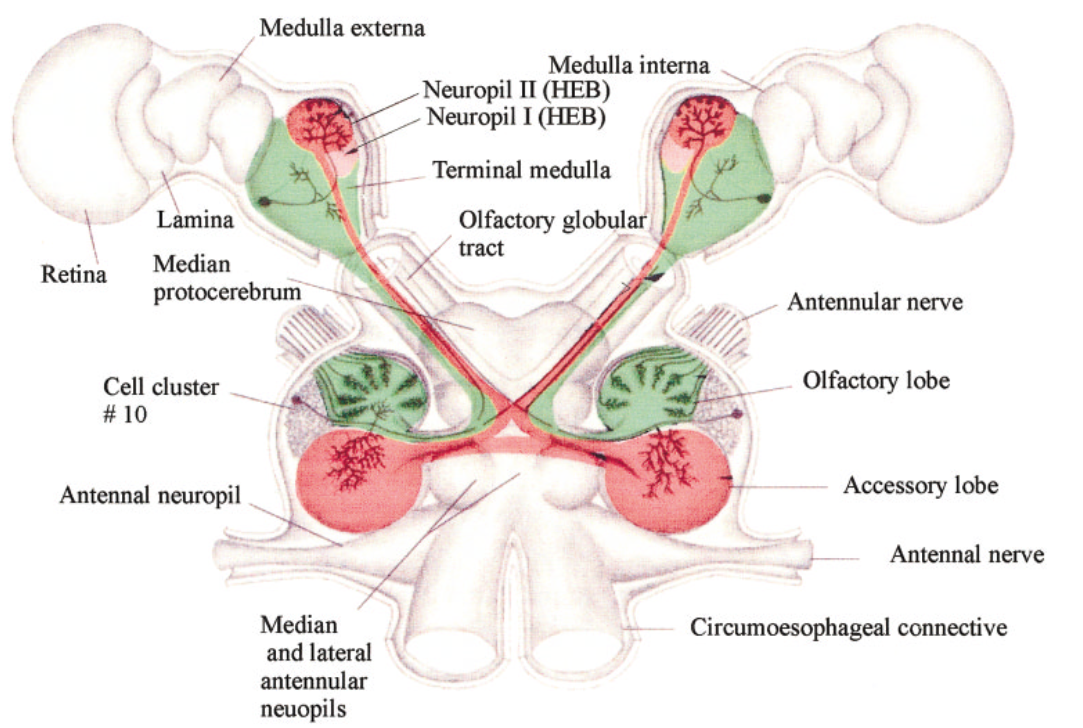
Fig. 30 Dorsal view diagram of the brain and visual ganglia of the crayfish and the neural structures within the optic cups. Theprojections of the olfactory lobe and accessory lobe to the lateralprotocerebrum (LP) are indicated in green and red tracks, respectively.The bilobed hemiellipsoid body (HEB) is dorsal to the terminal me-dulla. (From DeForest Mellon Jr3)
Pages:
Additional Resources:
Circadian clock function in isolated eyestalk tissue of crayfish.
Belusic, G. (2011). ERG in Drosophila. In (Ed.), Electroretinograms. IntechOpen.