
Lab Manual
Contents
Lab Manual
Today you will be using weakly electric fish and recording voltage in their tank using two sets of differential electrodes.
Software Setup
The bonsai workflow for today has an Analog Input node with two recording channels.
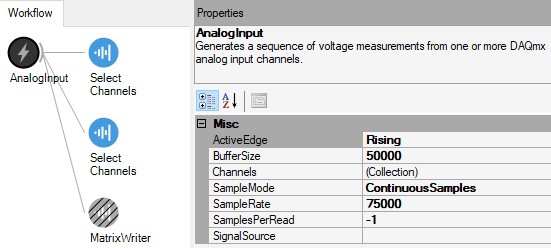
Fig. 6 Bonsai workflow for dual channel differential EOD data visualization and acquisition.
Each analog input channel is a differential electrodes, and the two differential electrodes are perpindicularly-oriented in the tank. Differential electrodes are referenced together for amplification, with a separate grounding electrode input into the circuit. The analog input is digitized by the Nidaq ADC before being streamed by Bonsai. By clicking on the Analog Input node, you can set the sampling rate of the ADC and buffer of the display in Bonsai. The sampling rate controls the ADC conversion and the buffer controls the size of chunks from the datastream that you can visualize at once in Bonsai. The electrode configuration for the Analog Input is specified in the Channels>{Collection} setting, which brings up the following window
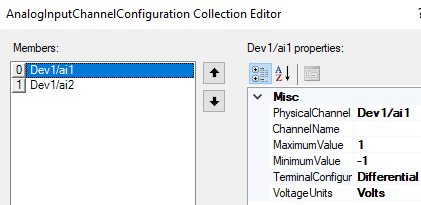
Fig. 7 Differential Electrode settings for EOD data acquisition. Note that we will be using channels ai4 and ai5 so the PhysicalChannel may need to be changed on your workflow accordingly. The Dev number may also be different on your computer (this reflects which USB driver the device is connected to).
The Matrix Writer node contains specifications for the file name and location where the file will be stored. Make sure the filename ends in .bin. If Overwrite is set to False, then your files won’t accidentally be overwritten. You can choose to append a timestamp or a file count to each filename if you re-use the same filename.
Note
Whenever you want to visualize the electrode measurements without accumulating stored data on the PC harddrive, just DISABLE the recording node.
Core Experiment
Hook up the tank electrodes from a weakly electric fish tank to your ADCs input (channels 4 and 5).
Run the bonsai protocol (with the Analog Input and Select Channels nodes ENABLED but the Matrix Writer node DISABLED. Double click the Select Channels nodes to visualize the measurement if it does not pop up upon start.
Tip
You can set the y axis range on the live data plots explicitly so that the visualization does not jump around the screen. Right mouse click on the bottom of the plot window and unclick auto, then specify the min and max y-axis values.
Tip
How could you determine which differential electrode corresponded to each channel in the Bonsai visualization?
Make sure that you can see EOD events in the signal (aka. make sure there is signal above the noise).
Stop the bonsai protocol and ENABLE the write node.
When you are ready to collect data, start the bonsai protocol and time the recording for about 1 minute using a sampling rate of 100kHz (recommended buffer of 50kiloSamples would visualize 500msec chunks of data at a time in the plot at 100kHz samplerate).
Repeat with different sample rates (10kHz and 50kHz)
Repeat for different species of fish (with 100kHz sample rate)
Housekeeping
Clean up your area.
Copy data to an external drive or your Google Drive for later.
Use the DataExplorer.py application to explore your raw data in detail. Use the Data Explorer notebook to process and analyse your raw data. Answer the questions in the Responses notebook.